
Sep 28, 20268 min read
A Guide to Mobile Tour Analytics That Drives Growth
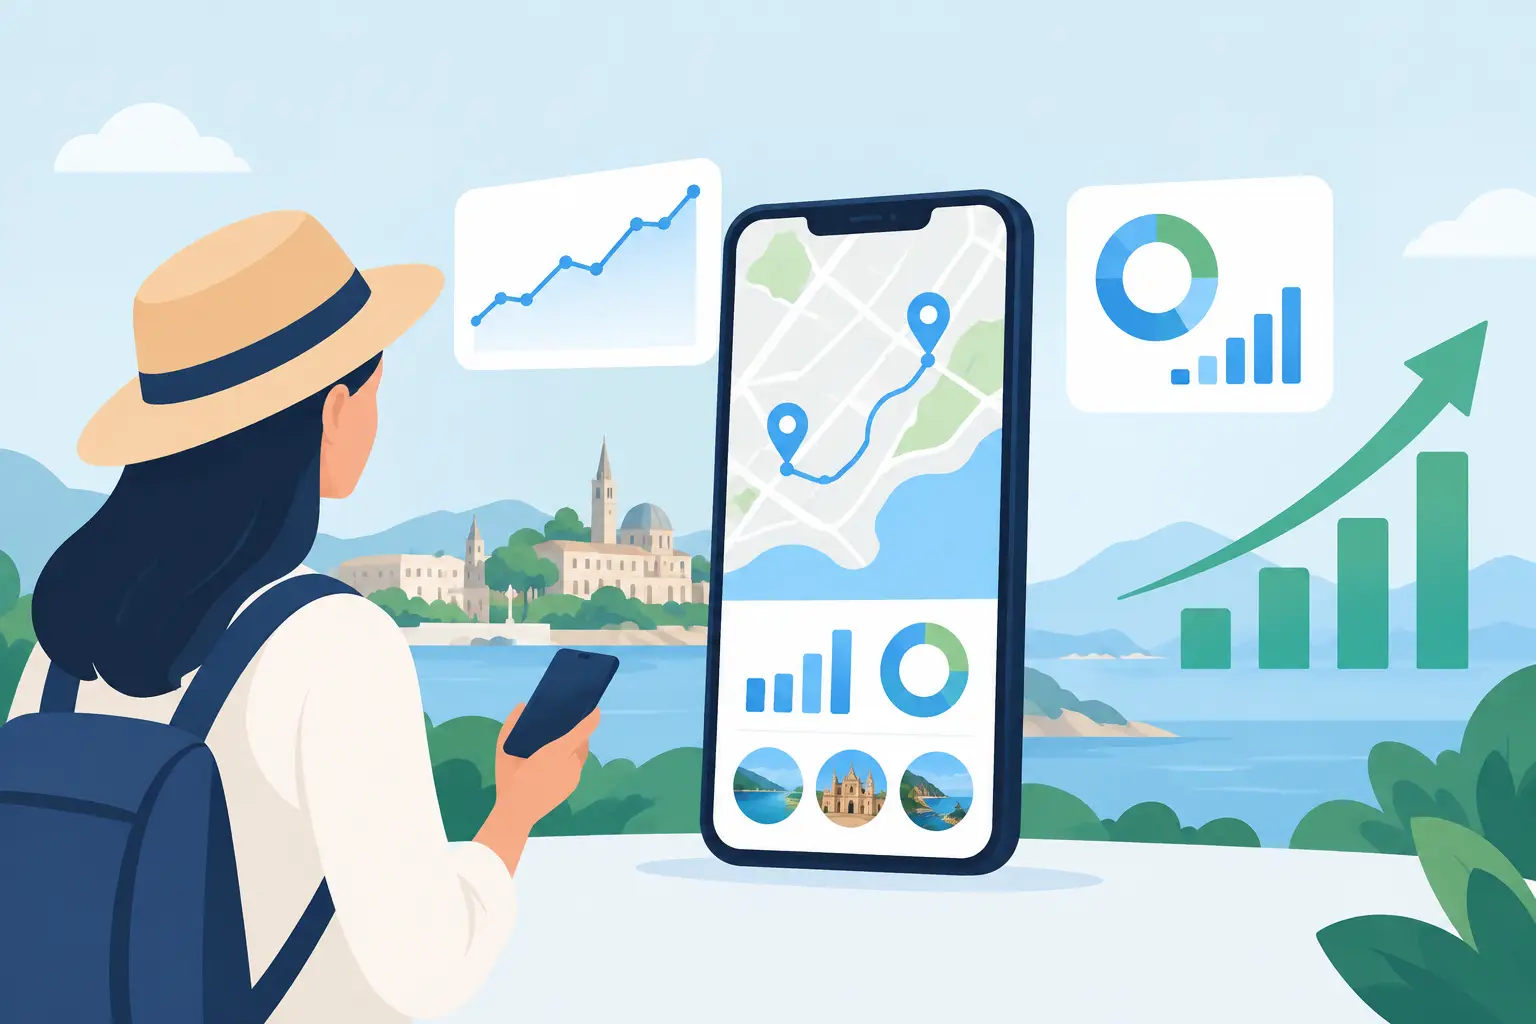
A guide to mobile tour analytics starts with a hard truth: a download is not an experience. A traveler may install a tour app in a hotel lobby, open it once near a landmark, then disappear before the first challenge. For interactive, self-guided tours, the numbers that matter happen out on the street - when people move, play, pause, discover, and decide whether the next stop is worth reaching.
For tour creators, destination teams, and cultural organizations, analytics turns a mobile experience from a digital brochure into a product you can improve. It shows where a story creates momentum, where GPS instructions create frustration, and where a well-timed reward keeps an explorer moving through the city.
Start with the tour outcome, not the dashboard
Analytics tools can report hundreds of events. That does not mean every event deserves your attention. Begin by defining what success looks like for the specific experience you are building.
A short museum district game may be successful when players complete three stops and claim a final digital collectible. A two-hour walking tour may prioritize full-route completion, time spent in partner locations, and positive post-tour ratings. An event activation might care most about how many participants begin during a narrow time window and share the experience with friends.
These goals are different, and so are the metrics behind them. If a tour is designed as a real-life exploration game, completion alone is not enough. You also want to know whether participants are actively engaging with clues, challenges, stories, and place-based interactions rather than simply rushing to the finish.
Set one primary outcome for each tour, then add a small number of supporting measures. This keeps teams from chasing attractive but empty numbers, such as total app opens, while missing the real question: did people experience the story you built?
The mobile tour analytics funnel
A useful mobile tour funnel follows the traveler from discovery to completion. Each stage reveals a different kind of friction or opportunity.
Discovery measures how people find the tour. This may include destination pages, QR codes, social campaigns, hotel referrals, creator profiles, or partner promotions. Track the source that produces starters, not only clicks. A campaign with fewer visits but more tour starts is usually the stronger channel.
Activation begins when a traveler does the first meaningful action. For a walking experience, that might be granting location permission, selecting a route, reaching the first checkpoint, or opening the first story. This is one of the most valuable measurements because a large gap between installs and activation usually signals confusion, unclear value, or permission anxiety.
Engagement captures what happens during the route. Did explorers read story cards? Play audio? Solve challenges? Use augmented elements? Collect virtual items? Engagement events help distinguish a completed route from a genuinely immersive experience.
Progression shows movement from one stop to the next. This is where mobile tour analytics becomes especially practical. If 70 percent of users reach Stop 2 but only 35 percent reach Stop 3, investigate the handoff. The problem could be an unclear map, a closed pathway, a clue that is too difficult, a weak narrative transition, or simply a stop that does not feel rewarding enough.
Completion and return reveal the long-term value of the experience. Look at tour completion, final reward claims, ratings, repeat sessions, saved tours, and starts of a second experience. A self-guided tour can create value well beyond one walk if it gives visitors a reason to keep discovering the city.
Measure the moments that shape the experience
The best event tracking reflects the actual mechanics of your tour. A generic event called screen_view will not tell you why explorers stayed engaged or left. Build events around moments that matter in the field.
For a story-driven experience, track stop opened, story completed, media played, clue viewed, answer submitted, challenge completed, and reward collected. For navigation, record route started, directions opened, GPS checkpoint detected, manual check-in used, and waypoint skipped. For commercial performance, connect purchase, redemption, upgrade, partner offer viewed, and partner offer redeemed.
Context matters as much as the event itself. Attach details such as tour ID, stop ID, content type, device type, language, acquisition source, and approximate time between stops. This makes it possible to see whether a particular audio segment works brilliantly in English but loses users in another language, or whether one checkpoint repeatedly fails on certain devices.
Avoid collecting personal location history simply because you can. Travelers expect location access to power the experience, but trust is part of the product. Use clear consent language, collect only what improves the tour, reduce precision when exact coordinates are unnecessary, and set sensible retention rules. A destination does not need to know a visitor's entire day to learn that a checkpoint causes repeated failures.
Read the city, not just the screen
Mobile tours have a challenge that many digital products do not: the experience takes place in an unpredictable physical environment. Rain changes walking behavior. Construction closes a route. A crowded festival can turn a two-minute crossing into a 15-minute delay. Battery level, network coverage, street noise, and sunlight can all affect participation.
That is why time-on-stop needs careful interpretation. A long dwell time can mean visitors are captivated by a viewpoint or deeply engaged with a puzzle. It can also mean they are lost. Pair timing data with actions. If users spend eight minutes at a stop while replaying audio and completing a challenge, the stop is likely working. If they spend eight minutes opening directions, retrying GPS, and skipping content, it needs attention.
Location patterns deserve the same nuance. A high skip rate may indicate poor content, but it may also signal that the place is inaccessible after business hours. Segment data by day, time, season, and route direction before rewriting a stop that may simply be affected by its operating conditions.
Find friction before it becomes abandonment
Drop-off analysis is where a good dashboard becomes a creator tool. Look for the exact action that occurs before people leave: a permission request, a payment screen, a confusing clue, an account requirement, or an unreachable GPS trigger.
Then validate the data in the real world. Walk the tour with the same phone conditions your audience has. Try it on a bright afternoon, with inconsistent signal, while carrying a bag, and without already knowing where the next landmark is. Desk-based analytics can identify the pattern. Field testing explains the reason.
A frequent issue is overcomplicated onboarding. Travelers want to start exploring, not complete a registration task beside a busy street. If activation is weak, test a shorter entry flow, show the first reward earlier, or explain location access at the moment it becomes useful. The right choice depends on your business model and the level of personalization you need, but every extra step must earn its place.
Turn data into better stories and stronger revenue
Analytics should influence creative decisions, not flatten them. If one stop has lower interaction, do not automatically cut it. It may be a quiet, reflective moment that gives the route pacing. Compare its performance with satisfaction, route completion, and the behavior immediately afterward. A low-action stop that helps users finish the tour can still be doing valuable work.
When a change is needed, test one clear hypothesis at a time. For example: replacing a text-heavy clue with an image clue will increase challenge completion at Stop 4. Or: moving a partner offer until after the first completed challenge will increase redemptions without reducing progression. Measure the result over enough participants to avoid reacting to a handful of unusual sessions.
For B2B partners, translate metrics into outcomes they recognize. A café partner may care about offer views and redemptions. A destination organization may care about exploration across less-visited neighborhoods. A cultural institution may care about story completion and repeat visitation. The tour data should make the value of participation visible without pretending that every action is a direct sale.
Platforms such as Leplace make this feedback loop especially powerful because tours can combine route data, game mechanics, storytelling, and creator-led experiences in one mobile format. The goal is not to make every city walk feel identical. It is to give creators enough evidence to improve what makes their local story distinct.
Build a weekly analytics rhythm
Do not wait for a quarterly report to discover that a key checkpoint has been failing. Review activation, progression, completion, and technical errors weekly, especially after a new launch or route update. Keep a simple change log so the team can connect shifts in performance to a new clue, adjusted route, campaign, or local disruption.
Once a month, step back from individual stops. Look for repeatable patterns across tours: which themes create the strongest completion, which neighborhoods produce the longest sessions, which acquisition sources bring engaged explorers, and where users are most likely to begin a second experience.
The most useful data point is the one that leads to a better next walk. Watch how people move through your experience, respect the messy reality of cities, and let every insight make the next discovery feel more worth leaving the sidewalk for.
Enjoyed this post?
Comments
Be the first to comment.